Experience
CSS Daytawith CSS Day
Svelte, CSS Data API, MapboxGL
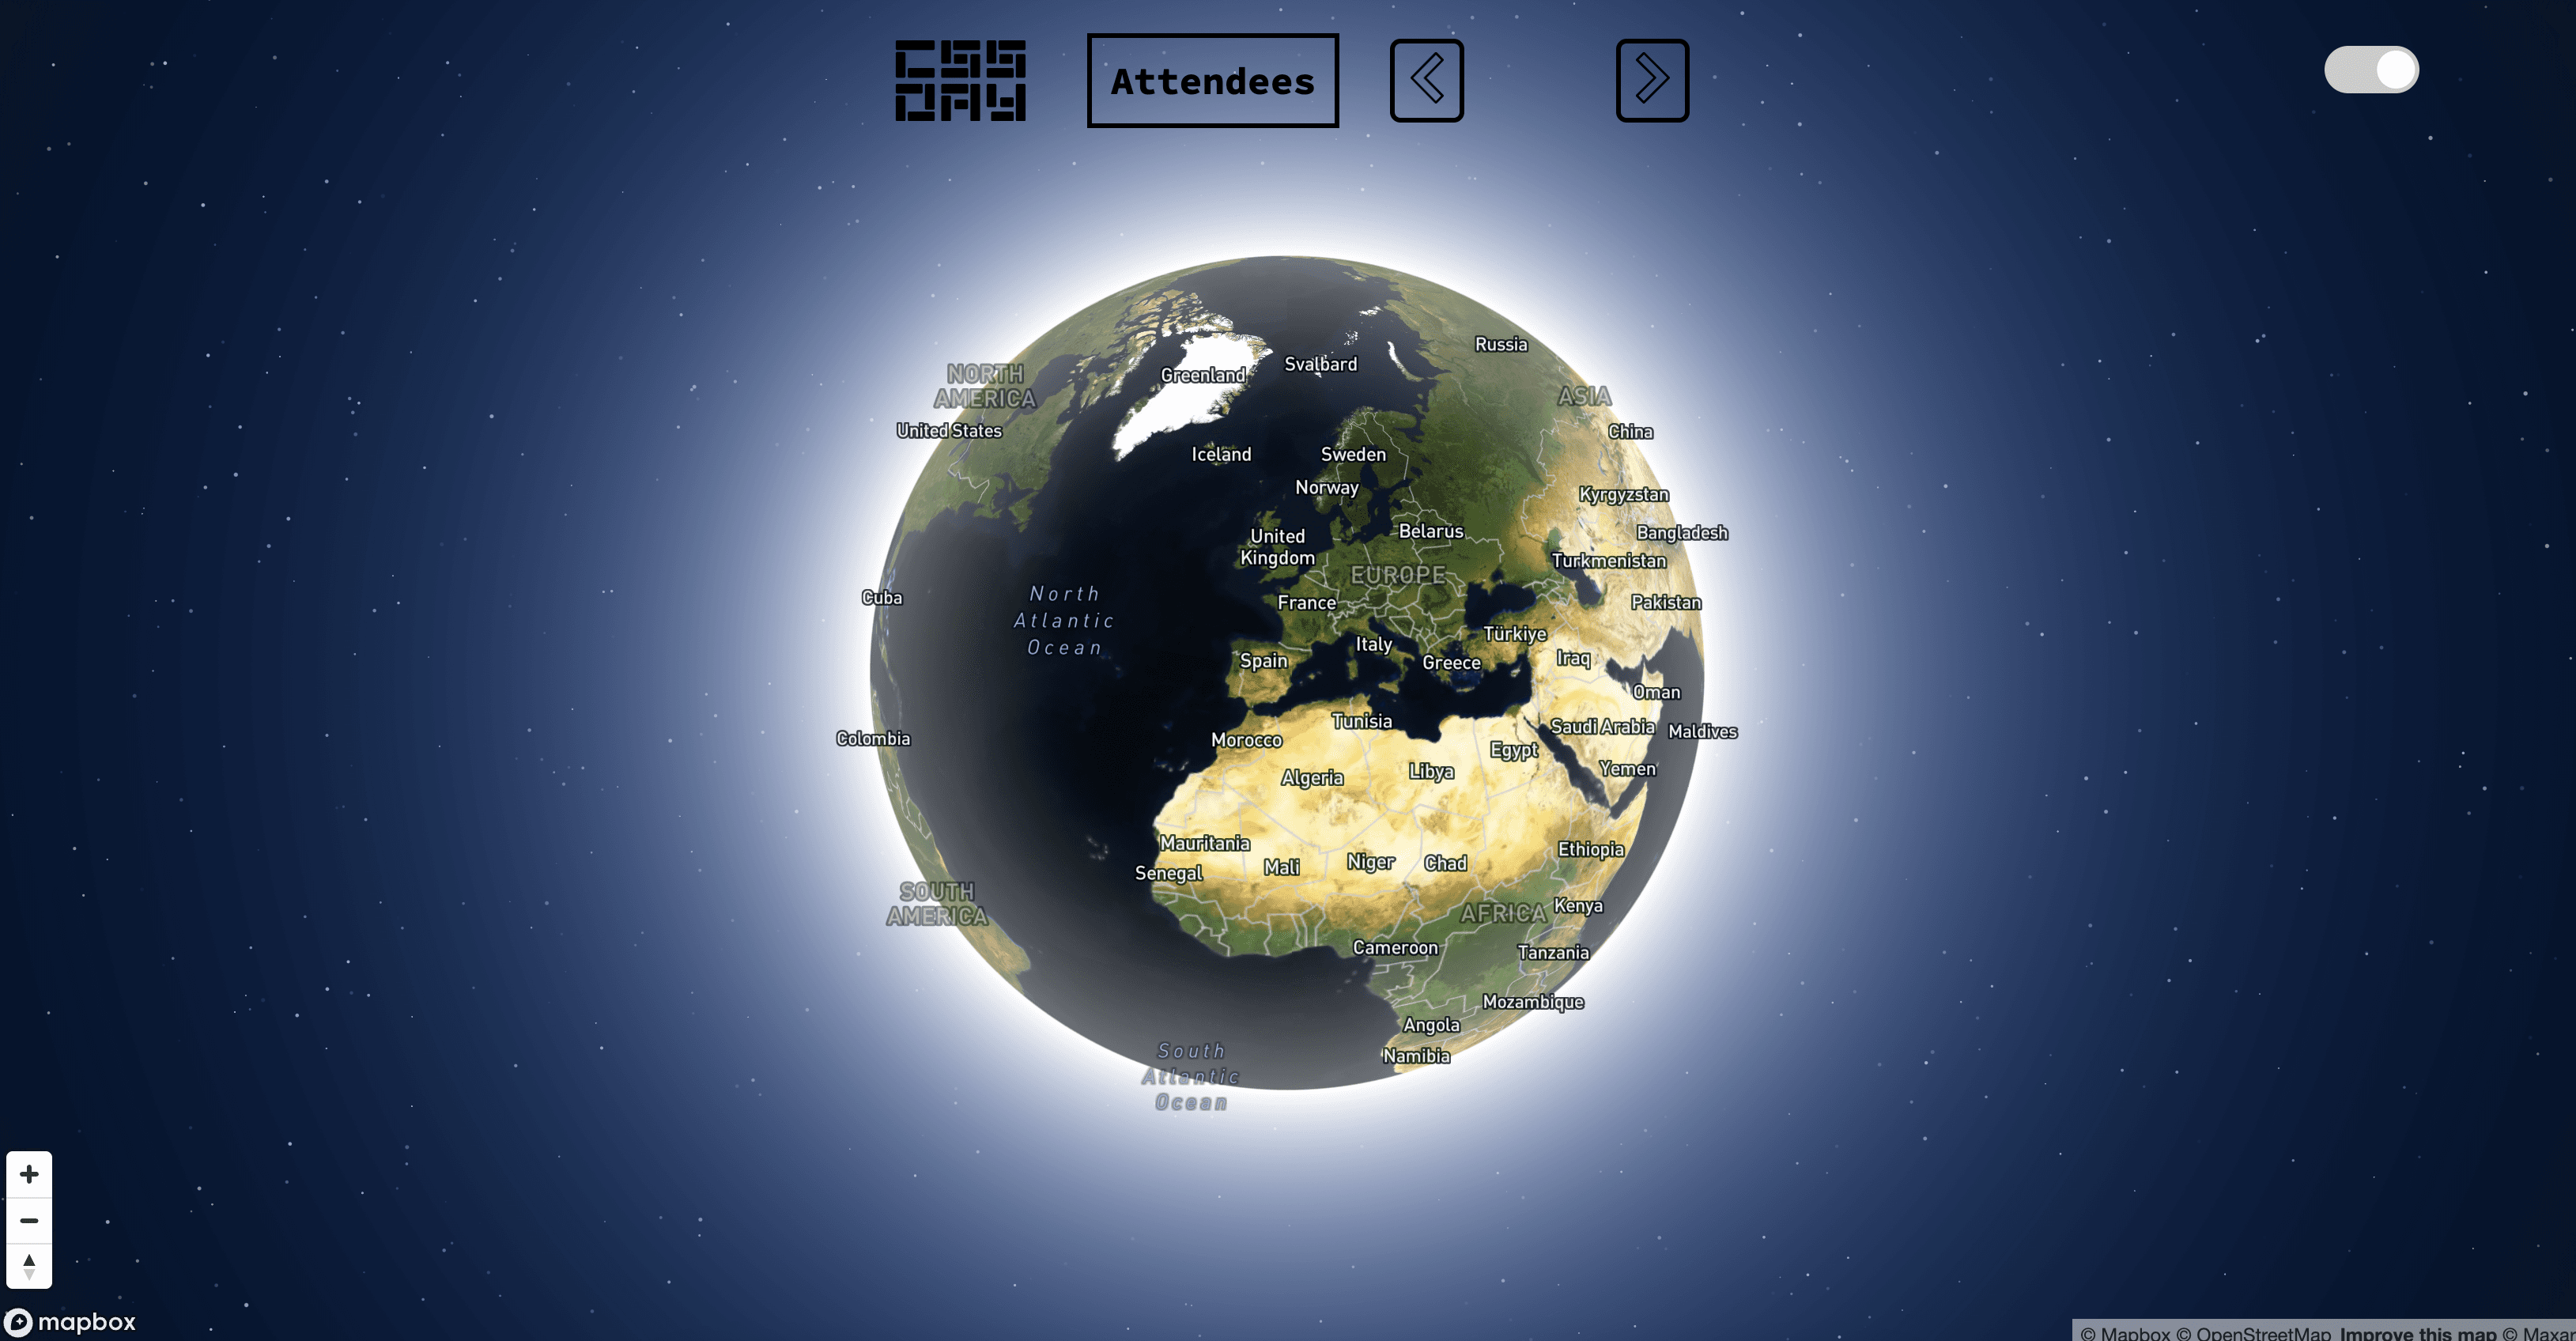
Built an interactive world map for CSS Day’s 10-year anniversary, visualizing visitor data per country and year using color and opacity to show the event’s growing global reach.
Overview
CSS Dayta is an interactive data visualization project created for the 10-year anniversary of CSS Day. The project visualizes visitor data across different years on a world map, allowing users to explore how CSS Day’s international reach evolved over time.
Project snapshot
- My role: Front-end developer / Data visualization
- Team: University team project at the Minor Web Design & Development
- Type: Educational / Event-related project
- Stack: Svelte, CSS Data API, MapboxGL
The challenge
The main challenge was translating abstract, multi-year event data into a visualization that felt both intuitive and visually engaging. Each year needed to be distinguishable while still allowing users to compare data across time. Additionally, the project relied on the CSS Day Data API, which required careful data mapping and transformation. Designing a clear visual language for representing visitor counts per country without overwhelming or cluttering the map was a key consideration.
The solution
I built an interactive globe using Svelte and MapboxGL, driven by data from the CSS Day Data API. Each year was assigned its own color, and visitor presence per country was visualized through color opacity. The more visitors from a country, the stronger the color. Users could browse through different years, instantly seeing how CSS Day’s audience expanded globally over time. The visualization focused on clarity, performance, and smooth interaction, keeping the experience lightweight and exploratory.
My contributions
- Designed and implemented an interactive world map using MapboxGL
- Integrated the CSS Day Data API and transformed raw data for visualization
- Developed a year-based color system to distinguish data across editions
- Mapped visitor counts to opacity values for intuitive comparison
- Built the interface in Svelte for reactive updates and smooth interaction
Challenges & learnings
This project deepened my understanding of mapping data to visual variables such as color and opacity, and how small design choices can significantly impact readability. I also learned how to structure visualizations that support exploration over explanation. Even though the API has since been deprecated, the code is still up for viewing. I got to build on experiences and knowledge gained during the minor Information Design-Tech where I learned how we can best visualise complex data such as this.
Outcome
The result was a visually clear and interactive globe that showcased 10 years of CSS Day visitor data. While the API is no longer active, the codebase remains available.